Forex Volatility: What Causes It and How Is It Measured?
Forex volatility measures how much and how fast a currency pair's price moves, not which direction it heads. This guide covers what causes it, how it differs by pair, and how to measure it.

What Is Forex Volatility?
A car's speedometer and its compass measure two completely different things. The compass shows which way you're heading. The speedometer shows how fast you're covering ground, regardless of direction. Forex volatility works like that speedometer: it measures how much and how fast a currency pair's price is moving, not which way.
High forex volatility means price is moving through a wider range, faster, over a given period. Low volatility means price is moving through a narrower range, more slowly. Neither one is automatically good or bad. High volatility can bring bigger price swings in either direction. Low volatility can mean calmer conditions, though calm isn't the same as predictable.
None of this says anything about direction on its own. A currency pair can show high forex volatility while trending up, trending down, or moving sideways in a wide range. Volatility describes the size and speed of movement, not where price ends up heading.
Getting a feel for forex volatility on a live chart tends to make the distinction between size and direction click faster than reading about it.
Create an account and watch how price ranges shift across different market conditions.
Go to Pocket BrokerCurious how this actually shows up on a real chart? Reading about volatility only goes so far. Watching price ranges expand and contract on a live chart shows the pattern faster than any explanation can.
Create a Pocket Broker account and watch how price ranges actually shift across different conditions.
Why Currency Volatility Changes
Currency volatility doesn't stay constant. It shifts as new information reaches the market, and the size of that shift often depends less on the event itself than on how much it diverges from what the market already expected.
A handful of factors regularly show up behind changes in currency volatility:
Economic data releases, especially ones that differ meaningfully from forecasts
Inflation reports and shifting interest-rate expectations
Central bank decisions and the language used around them
Geopolitical events and sudden shifts in market sentiment
Liquidity conditions tied to the time of day and which markets are open
None of this works as a fixed formula where a given event always produces a specific level of currency volatility. The same type of news can land quietly one week and forcefully the next, depending entirely on context.
Getting familiar with how these shifts actually feel on a live chart, through try Pocket Broker demo, beats reading about volatility in the abstract.
News, Rates, and Central Bank Decisions
Major macro releases, shifting interest-rate expectations, and central bank decisions can widen price ranges quickly when they land. Watching a forex volatility indicator during these moments tends to show a visible jump, not because the news itself was necessarily dramatic, but because it caught the market off guard.
The surprise factor matters more than the headline. A widely expected rate decision can pass with barely a ripple on any forex volatility indicator, while an unexpected one moves price sharply within minutes.
Liquidity and Trading Sessions
Liquidity and timing shape forex market volatility too. Activity can differ across Asian, European, and American sessions, and particularly during the overlaps between them, when more participants are active at once. No single session gets crowned the most volatile one for every currency pair, since that depends on which pair and which conditions are actually in play.
How Forex Volatility Is Measured
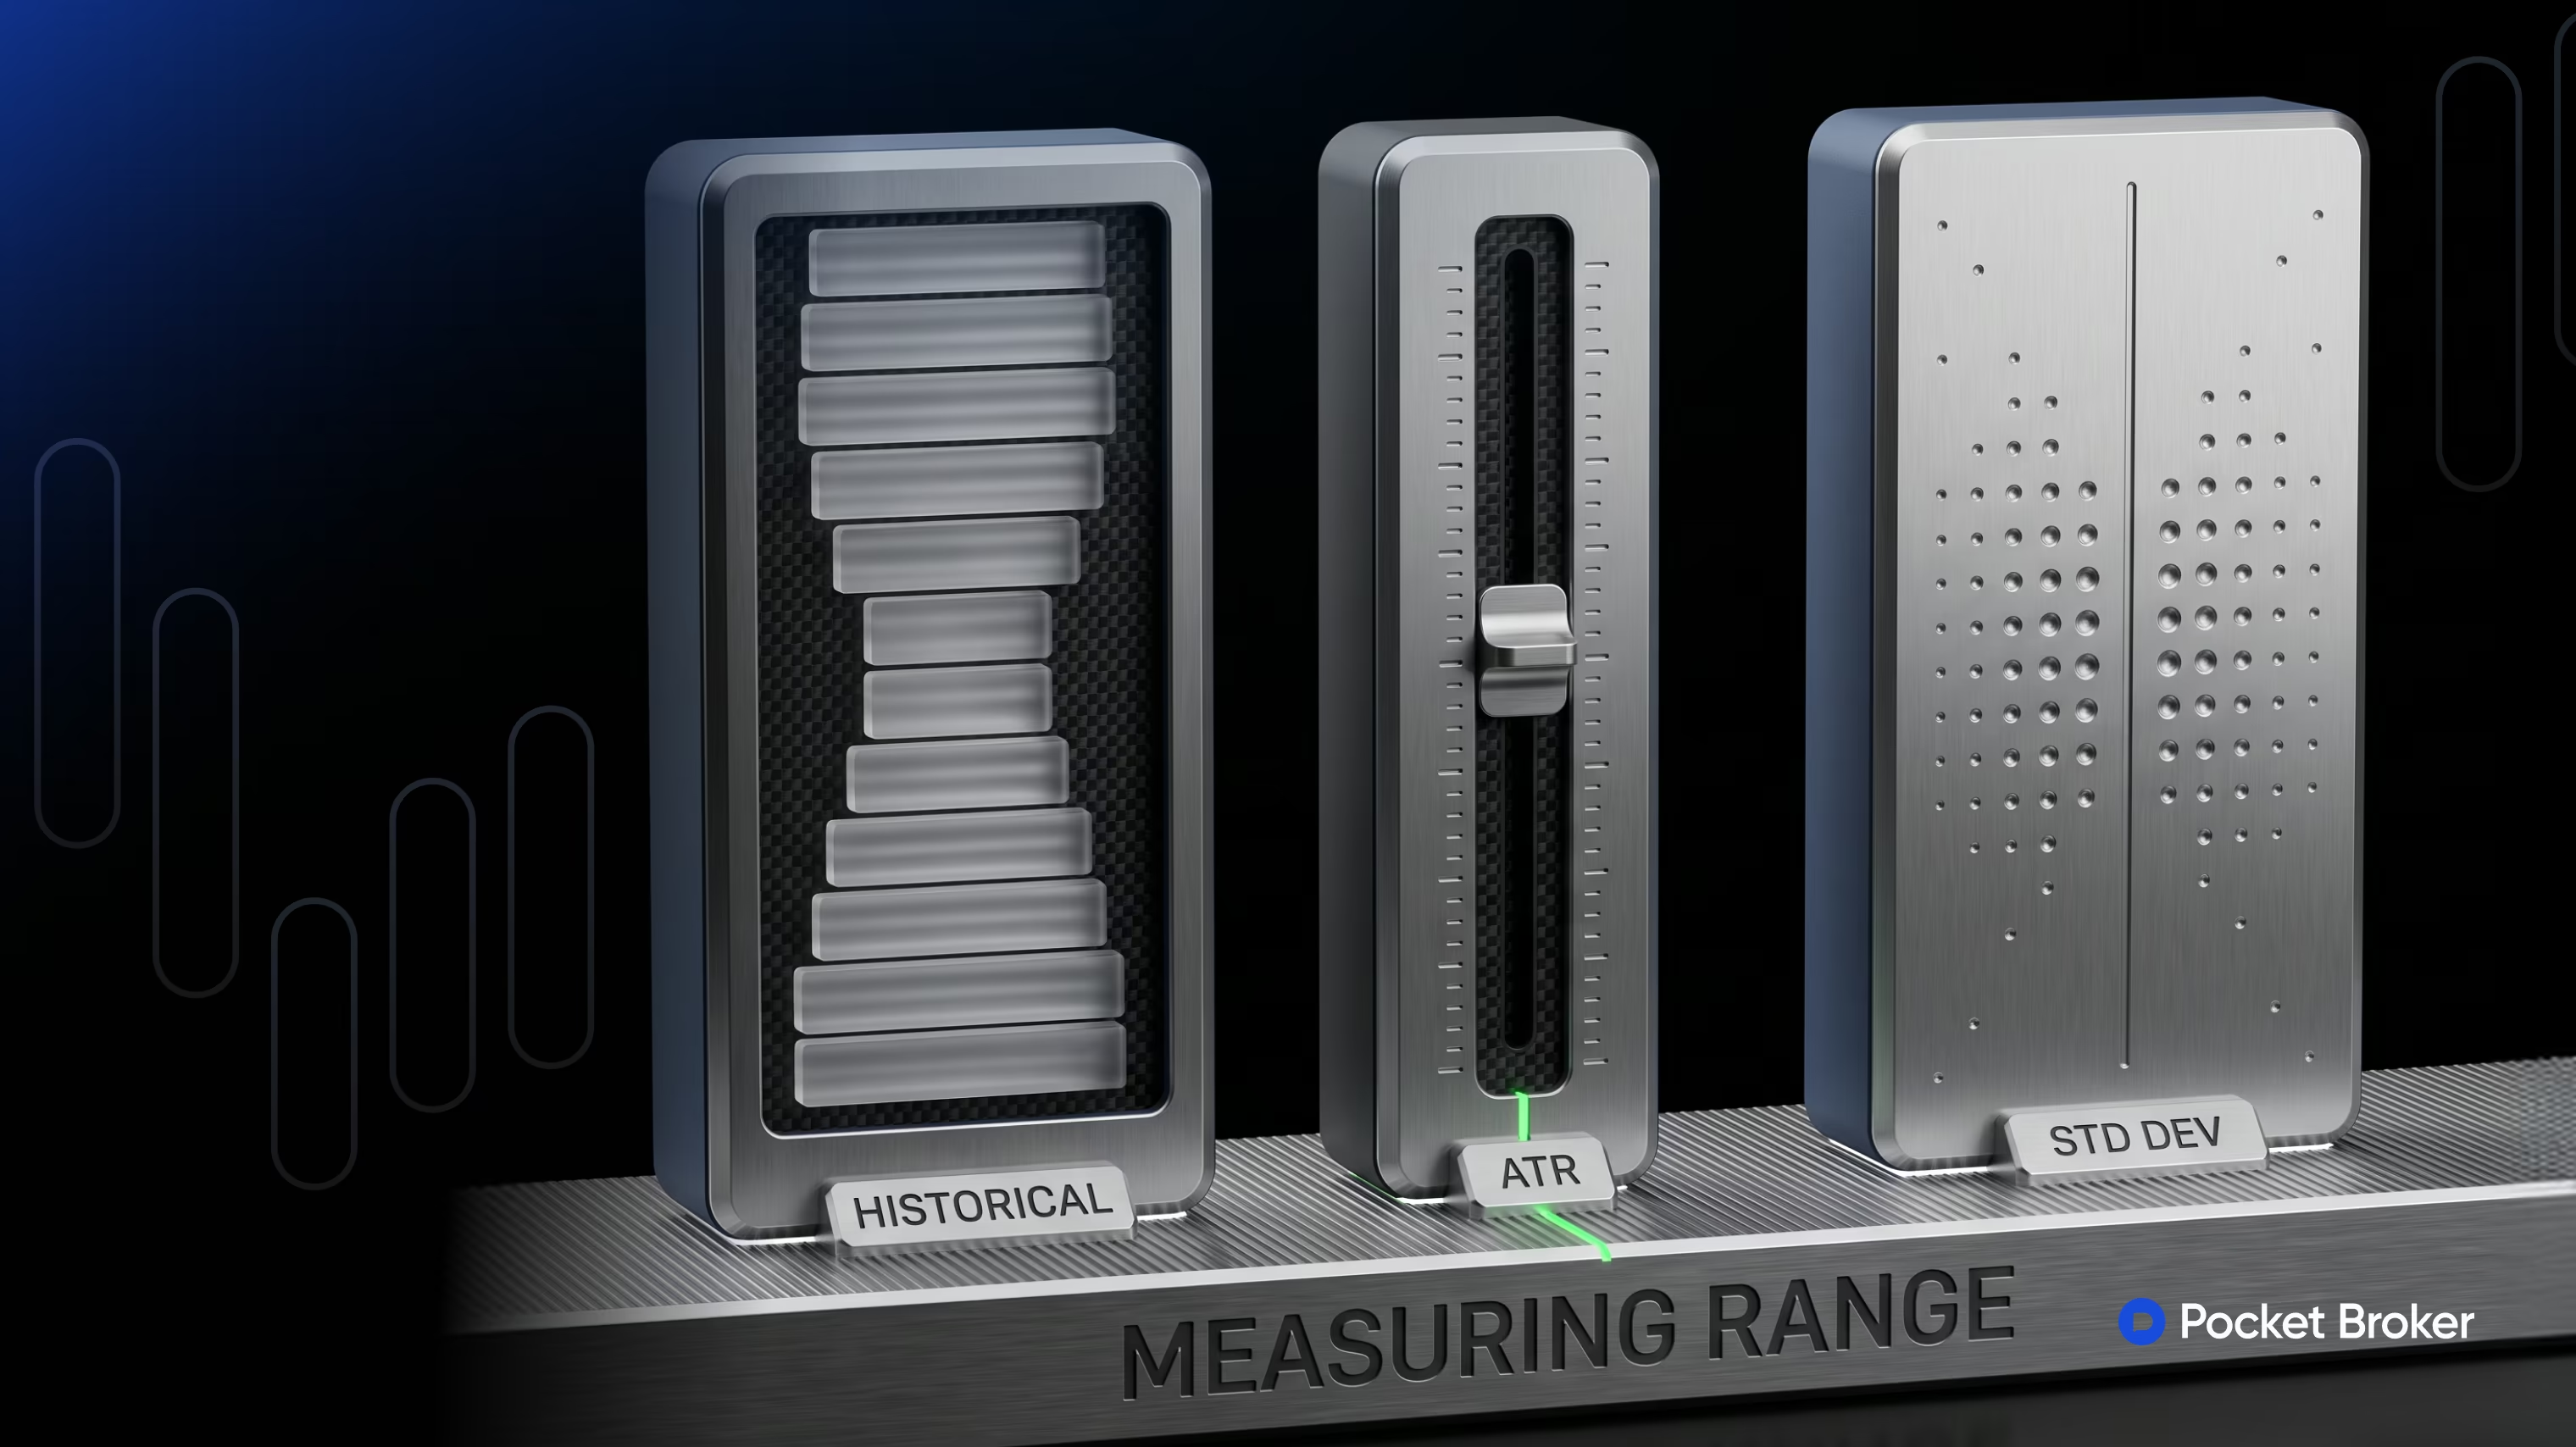
Measuring volatility in forex comes down to a handful of different approaches, each capturing the idea slightly differently.
Method | What It Shows | Main Limitation |
|---|---|---|
Historical price range | The size of past price movement over a chosen period | Reflects what already happened, not what comes next |
Average True Range (ATR) | A smoothed measure of typical price movement per period | Based on historical data, lagging by design |
Standard deviation | How much price has dispersed from its average over time | Sensitive to the specific period and data used |
No single method here gets treated as universally better than the others. Each one offers a different lens on the same underlying idea.
Forex Volatility Indicators
ATR and similar tools help estimate the size of recent price movement for a given currency pair volatility reading, without functioning as a standalone strategy or a separate guide of their own. These indicators work from historical price data. They don't predict future volatility with any guarantee, just describe what's already happened.
Why Currency Pair Volatility Differs
Part of grasping forex volatility meaning in practice means recognizing that different currency pairs rarely move the same amount. Liquidity, the specific currencies involved, typical trading hours, and sensitivity to macroeconomic events all play a role.
Picture a purely illustrative comparison: one pair built from two heavily traded currencies, another built from a major currency paired with a smaller, less liquid one. The second pair can behave quite differently from the first under the same market conditions. None of this amounts to a ranking of the most volatile pairs, since these relationships shift over time and any fixed list would go stale quickly.
High and Low Volatility in Practice
A rise in volatility tends to widen price ranges and speed up movement. It can also raise uncertainty and the chances of sharp reversals along the way, since faster price action leaves less room to react before conditions shift again. None of that translates into a ready-made trading setup on its own.
A drop in volatility tends to narrow ranges and slow things down. That doesn't guarantee stability, and it doesn't make price any more predictable, just quieter for a stretch.
When Volatility Can Be Misleading
A handful of real limitations are worth keeping in mind. Historical volatility describes movement that's already happened. It doesn't guarantee the same regime continues. A short lookback period can paint a different picture than a longer one covering the same market. A sharp spike right after news can fade quickly rather than mark a lasting shift.
Different indicators can measure slightly different aspects of volatility too, so two tools looking at the same chart won't always agree exactly, and adding more of them doesn't automatically remove that disagreement. None of this means volatility is the same thing as trend strength, trading volume, or market direction. Each of those describes a genuinely different property of price behavior, and treating them as interchangeable skips past what makes each one useful on its own.
Risk Disclaimer: Trading involves significant risk of capital loss. This article is for educational purposes only and does not constitute financial advice. Always conduct independent research and consider your risk tolerance before making any trading decisions.
See more:Forex & Markets